June 2018 REBGV Greater Vancouver Market Reports
Posted on
July 10, 2018
by
Michael Skinner
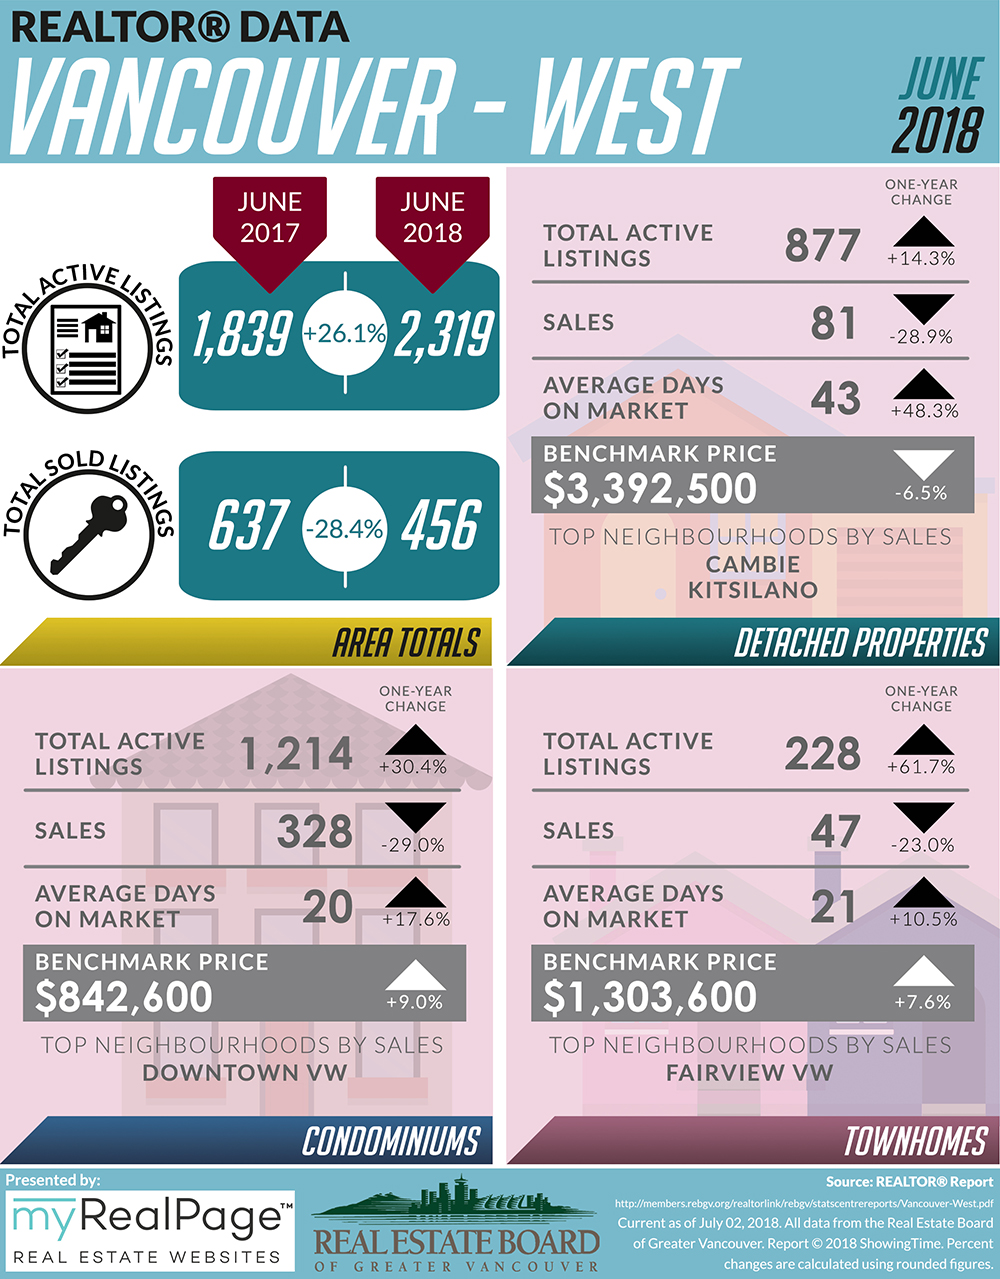
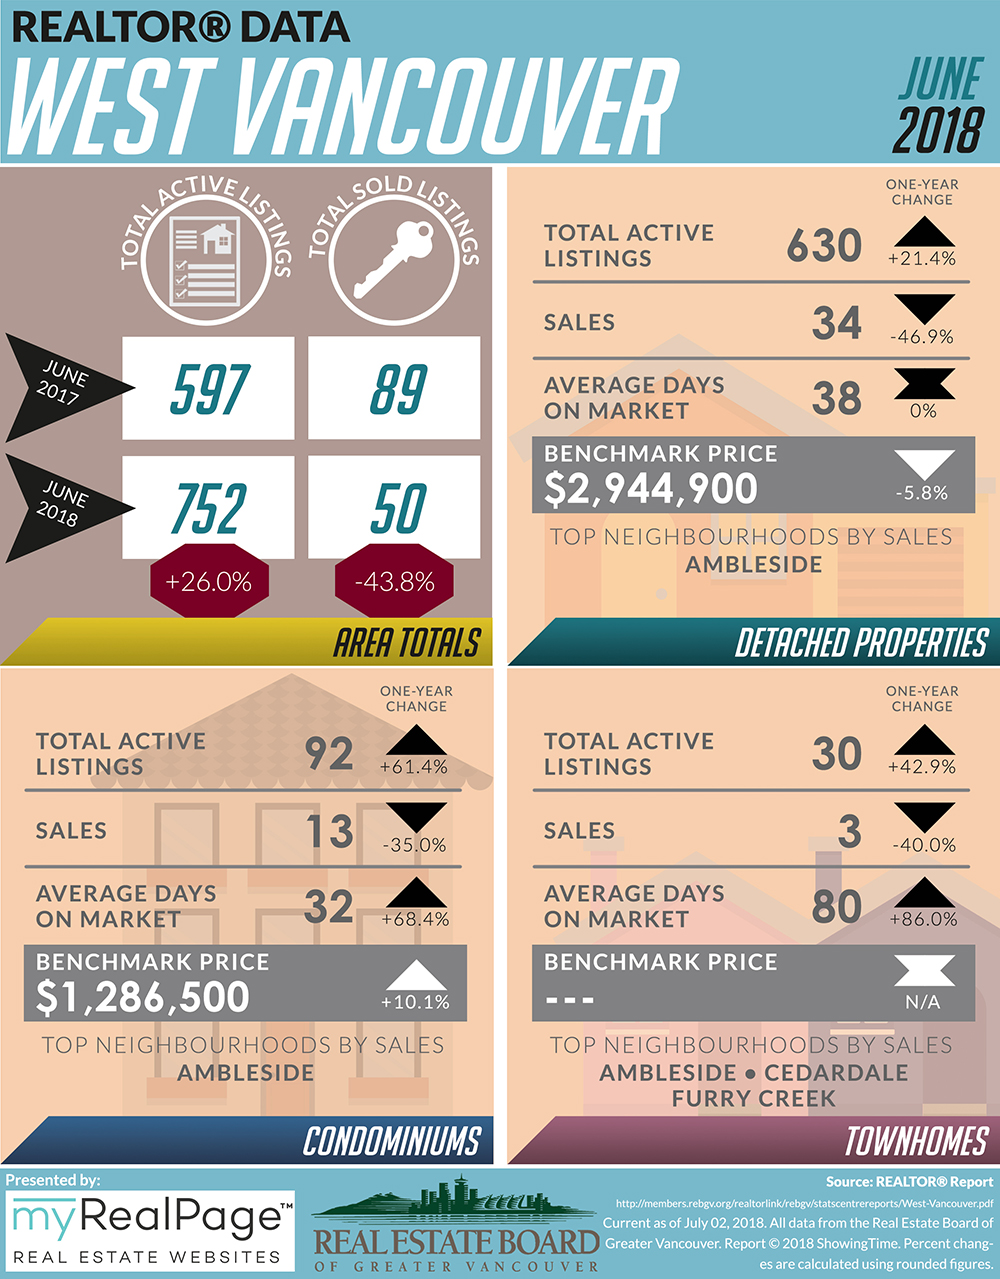
And just like that, the first half of the year is over! As we head into the second half, here are the latest Vancouver Market Reports from The Real Estate Board of Greater Vancouver (REBGV).
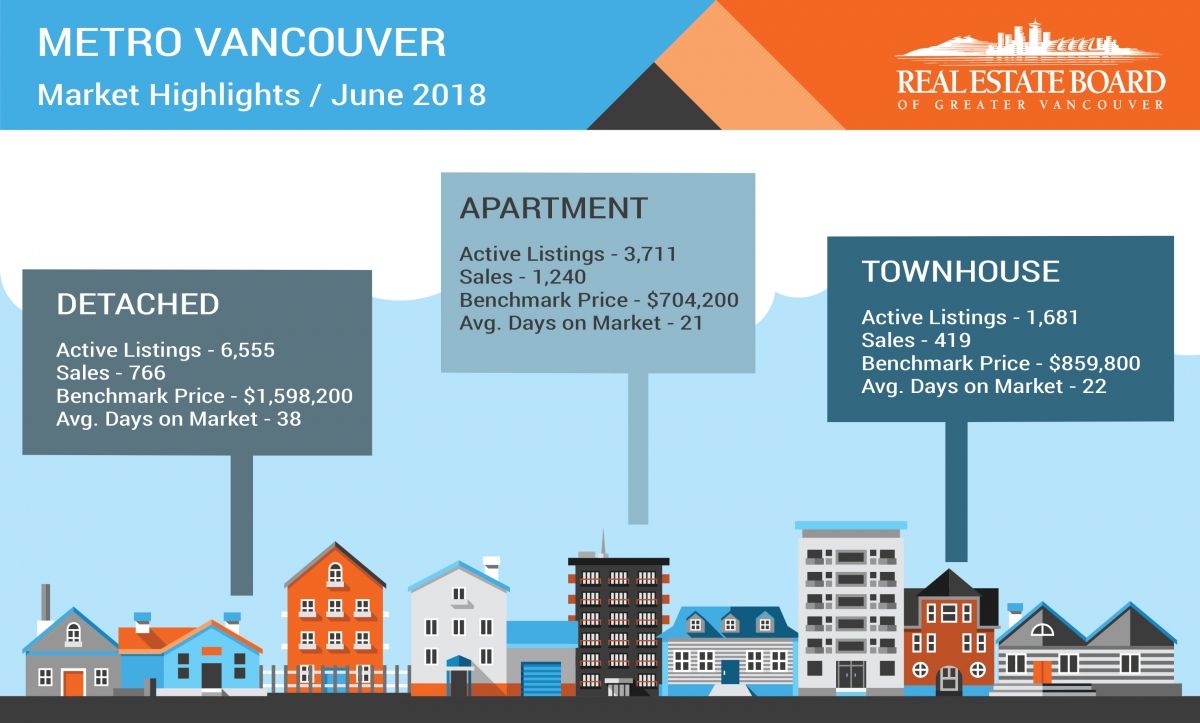
According to the latest REBGV press release, home sales have been dipping below long-term historical averages, while supply is at a three-year high as of June 2018. In fact, June 2018 sales were apparently 28.7% below the 10-year June sales average.
As REBGV President Phil Moore has noted, “Rising interest rates, high prices and more restrictive mortgage requirements are among the factors dampening home buyer activity today.”
He has also pointed out that it is currently a buyers’ market:
“With reduced demand, detached homes are entering a buyers’ market and price growth in our townhome and apartment markets is showing signs of decelerating.”
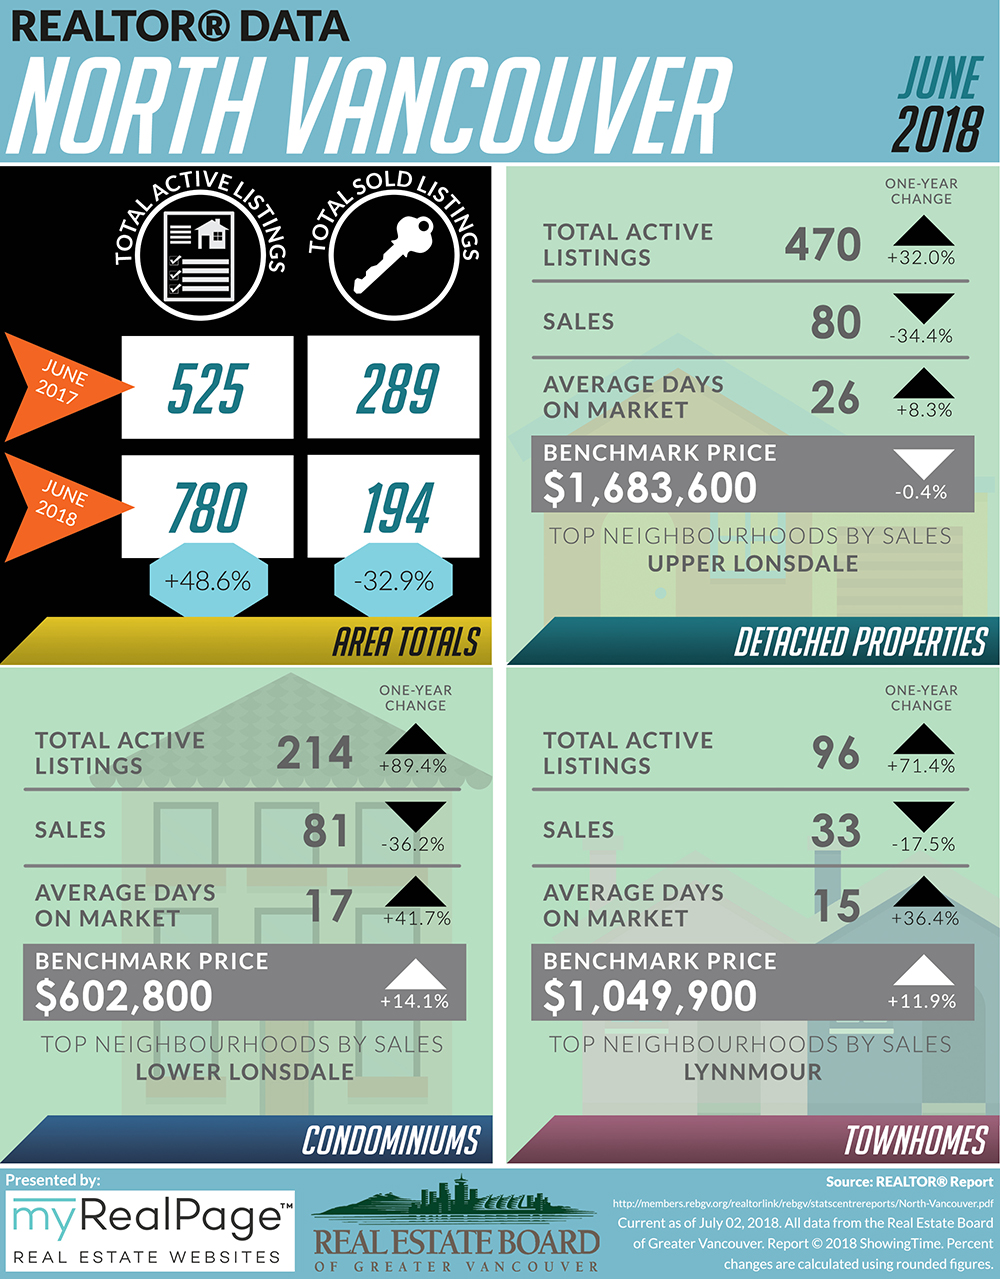
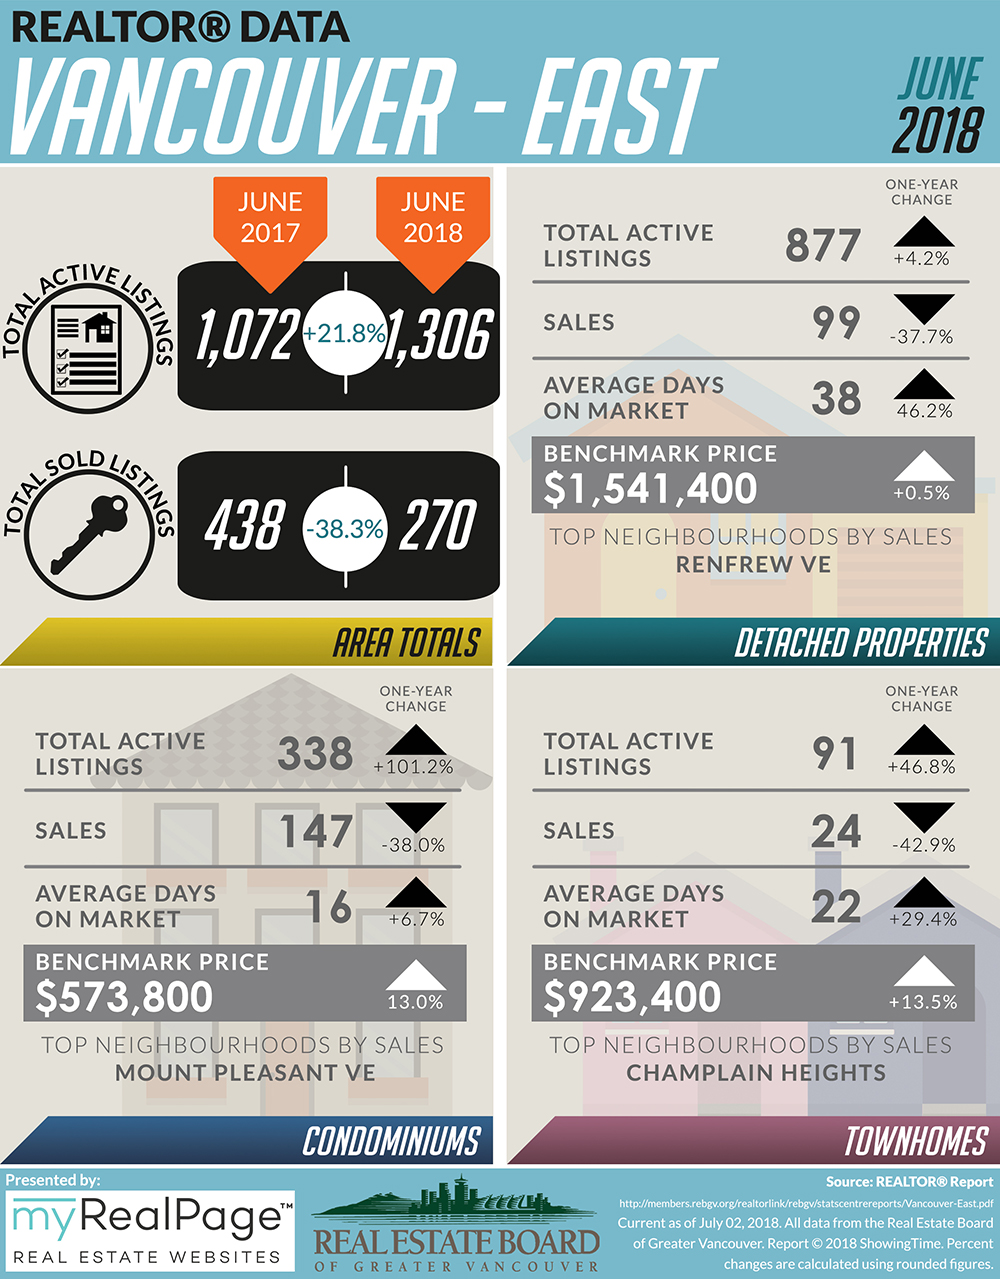
The following data is a comparison between June 2017 and June 2018 numbers, and is current as of July 2, 2018. For last month’s update, you can check out our previous post for May 2018 data.
These infographics cover current trends in North Vancouver, West Vancouver, Vancouver East, and Vancouver West.
May 2018 REBGV Greater Vancouver Market Reports
Posted on
July 9, 2018
by
Michael Skinner

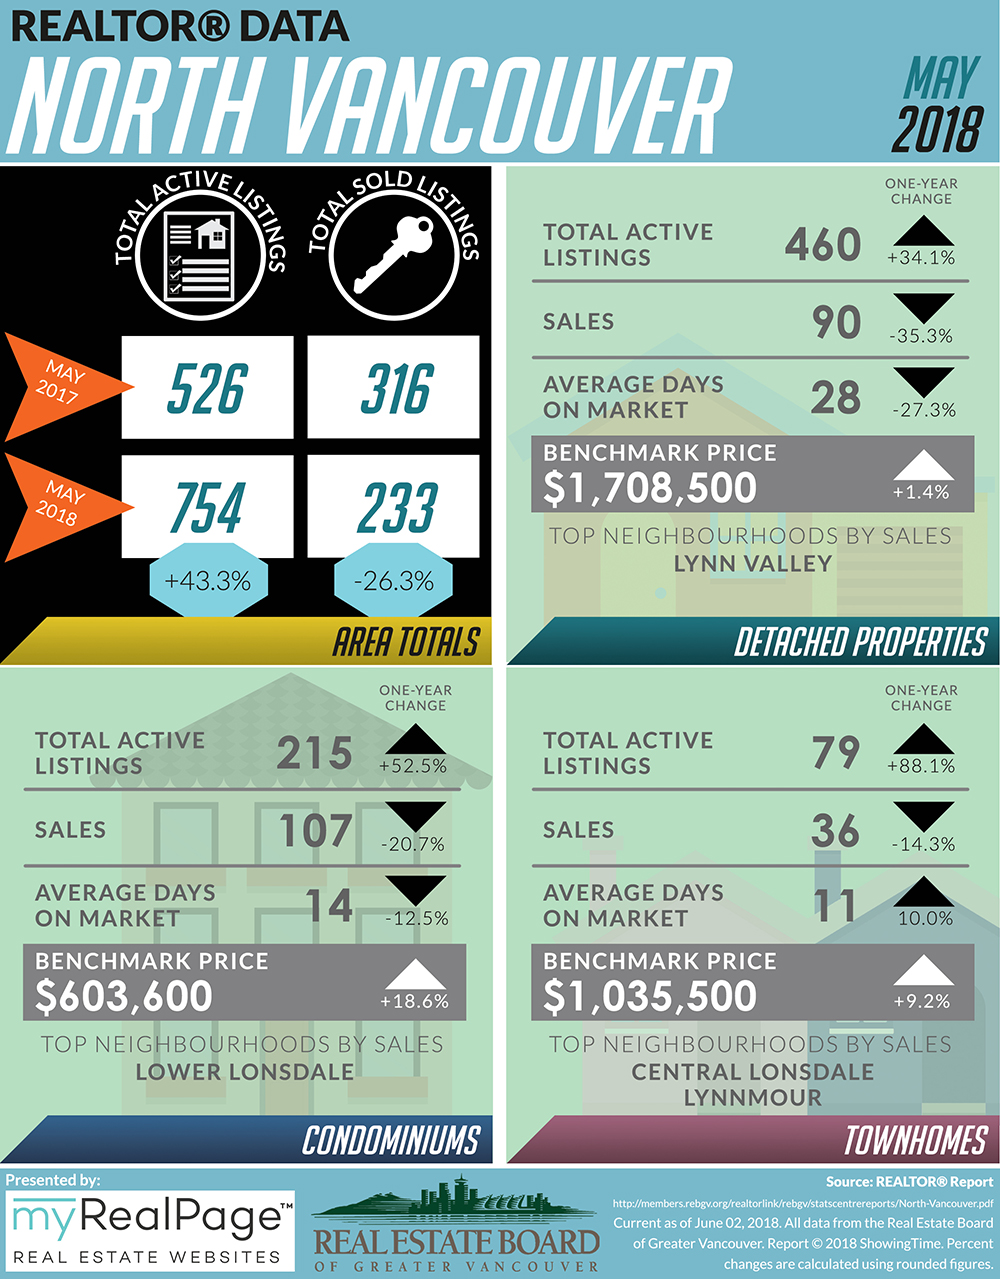
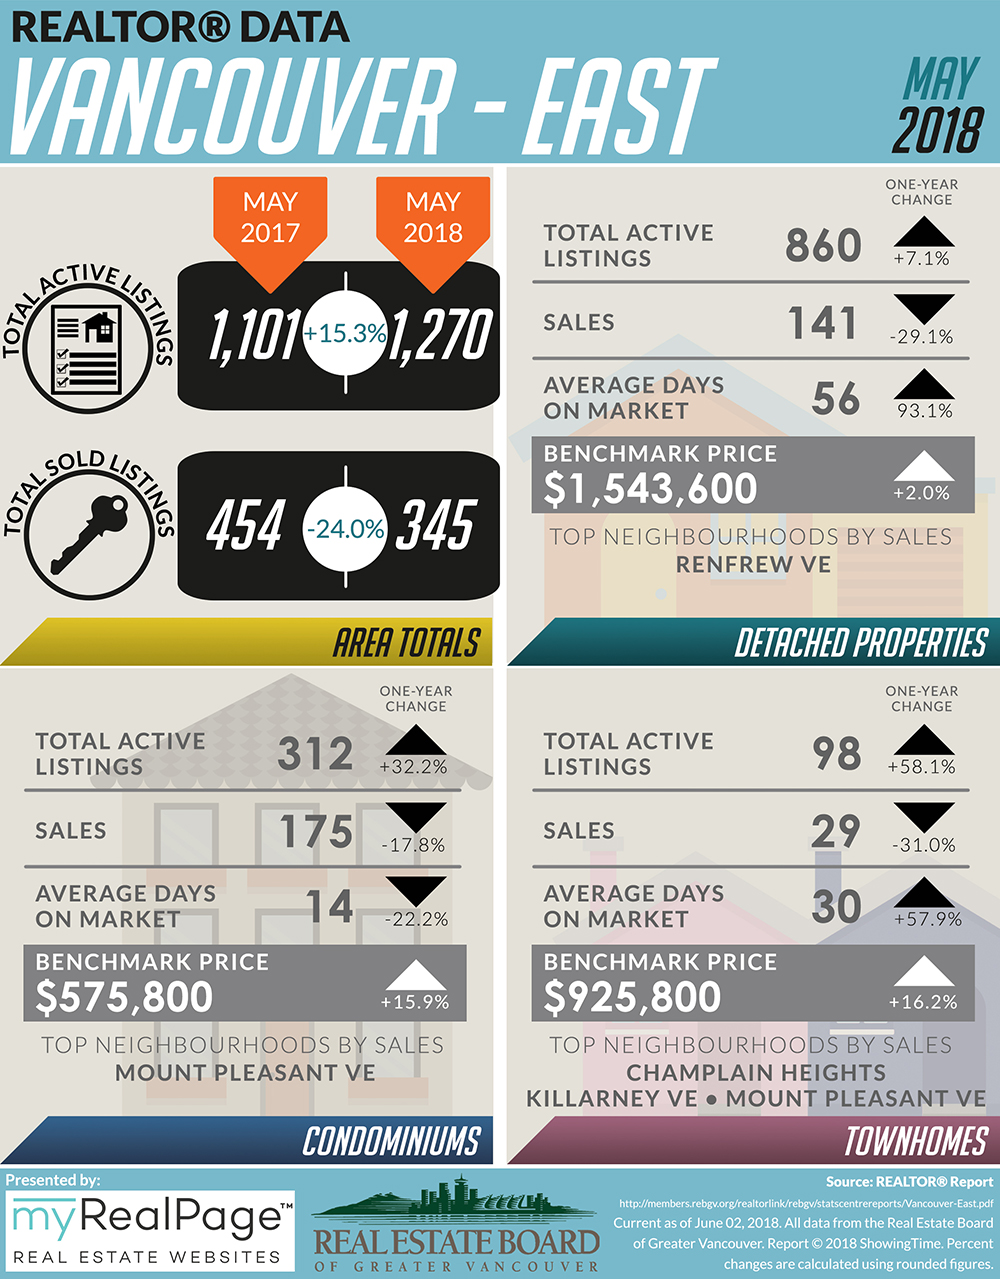
As we’re about to end the first half of the year, the downward trend in home buyer demand within the REBGV area is still continuing to make its presence felt.
According to REBGV’s latest release, May 2018 sales were 19.3% below the 10-year May sales average.
Phil Moore, president of the Real Estate Board of Greater Vancouver, has noted, “With fewer homes selling today compared to recent years, the number of homes available for sale is rising,”

He has also cited the rising inventory numbers, saying,
“The selection of homes for sale in Metro Vancouver has risen to the highest levels we’ve seen in the last two years, yet supply is still below our long-term historical averages.”
For home sellers, he advises that competitive pricing is crucial due to the shifting dynamics that are currently occurring in the market. As for home buyers, he has noted the importance of working with local Realtors in order to better understand these fluctuations and how it can affect them.
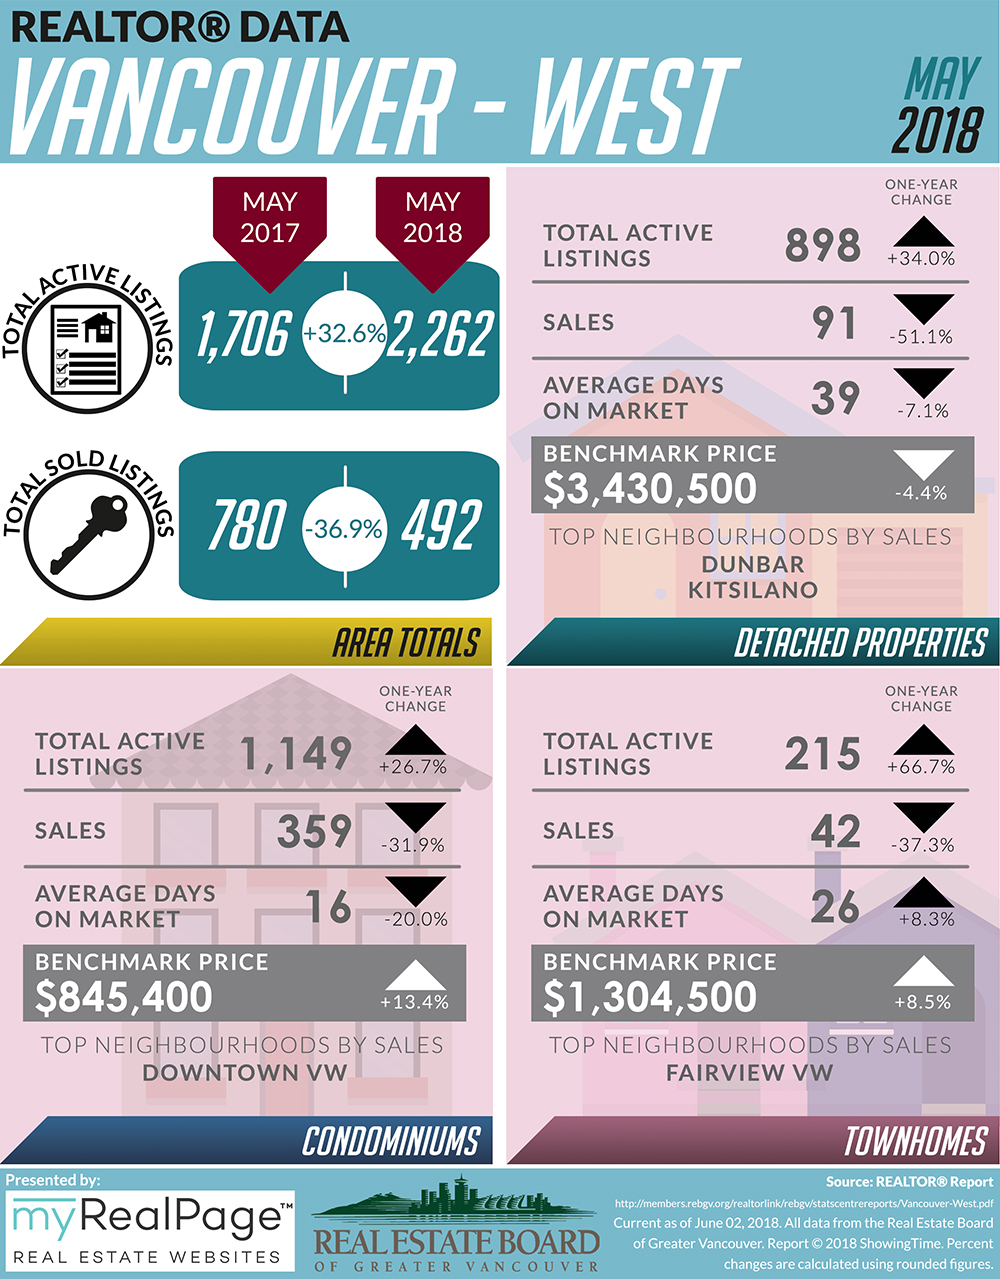
The following data is a comparison between May 2017 and May 2018 numbers, and is current as of June 2, 2018. For last month’s update, you can check out our previous post for April 2018 data.
These infographics cover current trends in North Vancouver, West Vancouver, Vancouver East, and Vancouver West.

Categories:
June 2018 REBGV Greater Vancouver Market Reports